COUNTY PROFILE
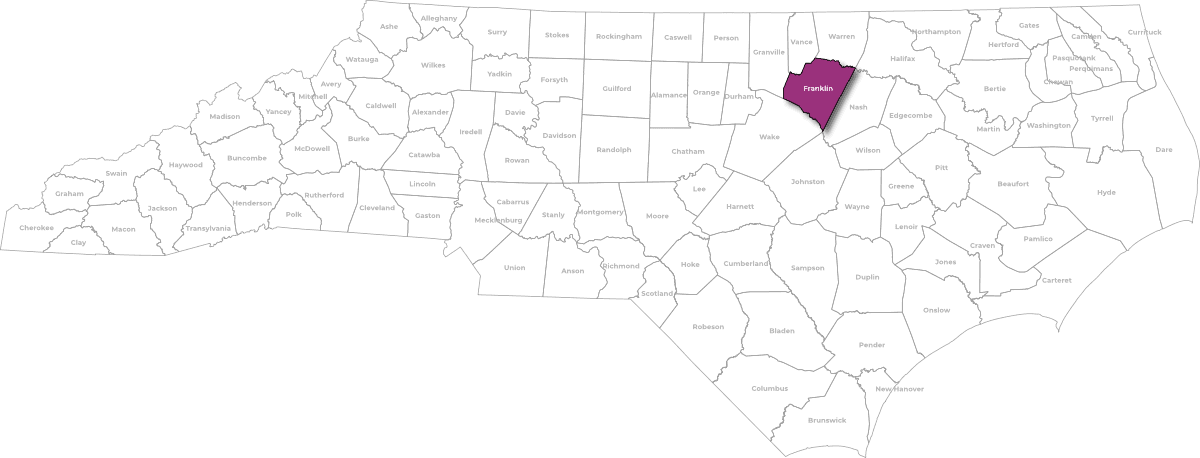
Franklin County
EASTERN NORTH CAROLINA
Team Up NC Analysis
Full Report Contents
Demography & Geography
History and projections
Race and ethnicity
City and Towns
Population density
Registered Voters
Partisan Lean
2024 election partisan lean by precinct
Franklin County population density
Voter Turnout
Excerpts
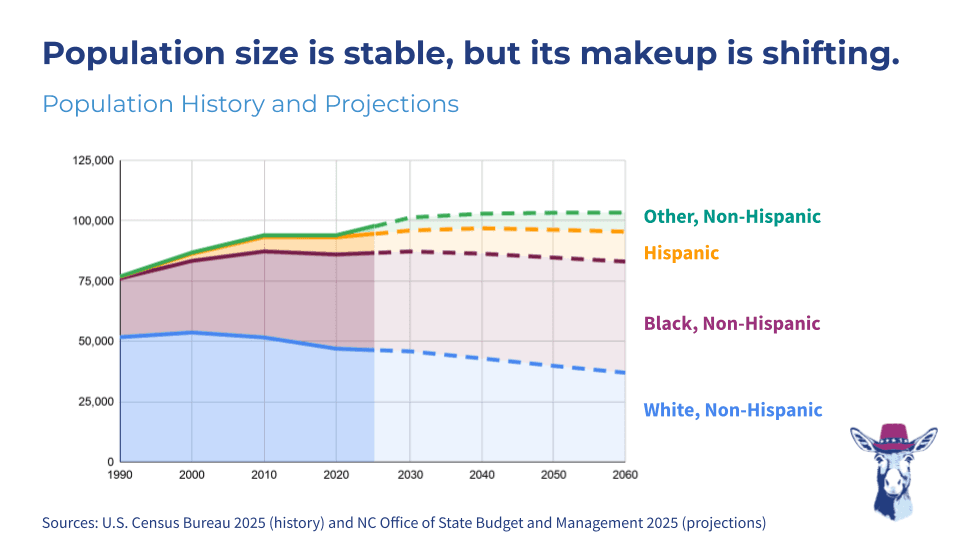
This chart shows the total population from 1990 to 2060. The colored areas represent different racial and ethnic demographic groups, which are stacked and therefore add up to the total.
The total population of Franklin County has has grown steadily since 1990 and is currently approximately 80,000 residents. It is projected to continue to grow steadily for the next 35 years, as shown in this graph.
The race and ethnicity of the population has been shifting slightly. In 1990, African-American Non Hispanic and White Non-Hispanic residents accounted for 99% of the population, and this figure is projected to drop to 78% by 2060. During that time, Hispanic people and people of other races and ethnicities are expected to move into Franklin County.
The next chart shows population by race and ethnic groups individually instead of additively.
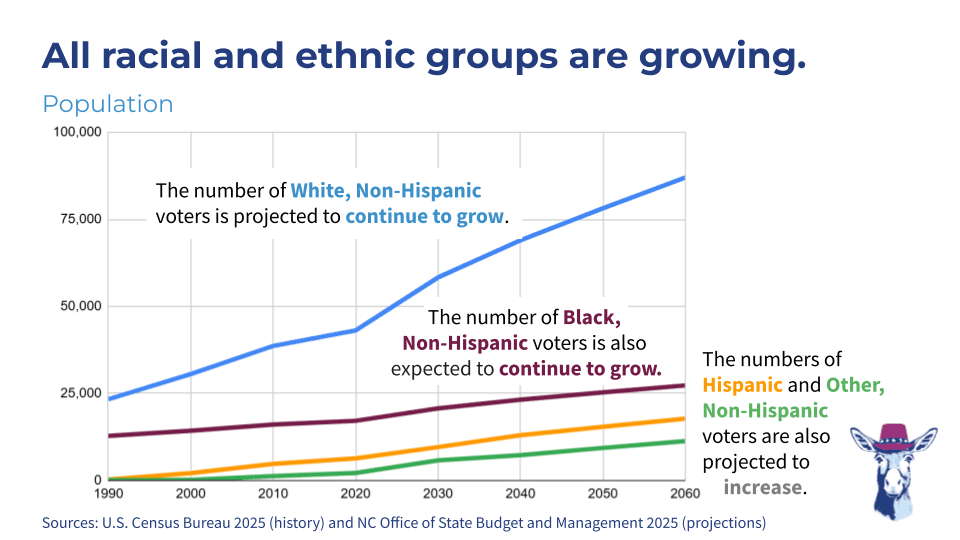
This chart isn’t additive. Instead, the lines representing racial and ethnic groups are superimposed over one another, which makes it easier to compare them.
Through 1980, population estimates were made only for White and Black residents. The explanation appears to be that very few members of other racial and ethnic groups lived in Franklin County. In 1990, the Census reported just under 300 Hispanic people and fewer than 100 people in other racial and ethnic groups living in the county.
The population of all of the racial and ethnic groups in Franklin County are projected to continue to grow over the next decades.
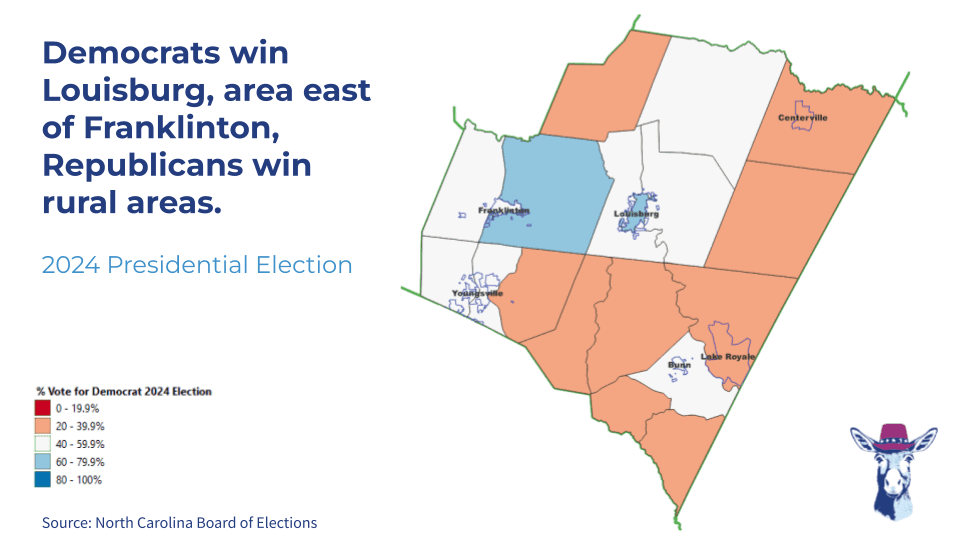
This map shows the partisan lean of Wilson County based on the 2024 presidential election where the intensity of blue or red indicates the portion of voters who supported the Democrat or Republican candidate, respectively.
For the most part, Franklin leans right. However, the precinct to the east of Franklinton and in Louisburg leans left, and several precincts are moderate.
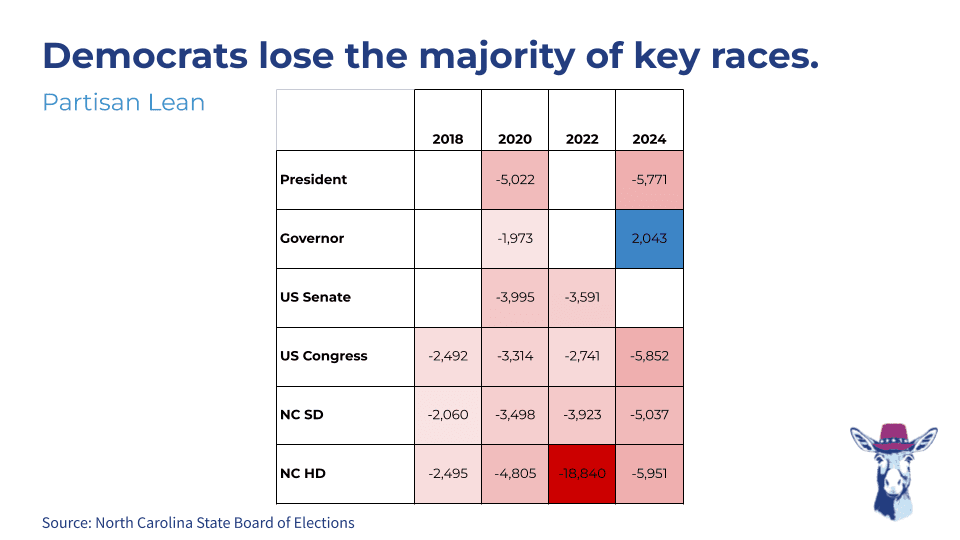
In the end, it’s the elections that matter, and this table shows that Democrats have lost 17 out of 18 key races since 2018.
The numbers in the table are the margin between the winner and loser of each race, where blue indicates that the Democrat won and red indicates that the Republican won. The intensity of the color is proportionate to the margin.
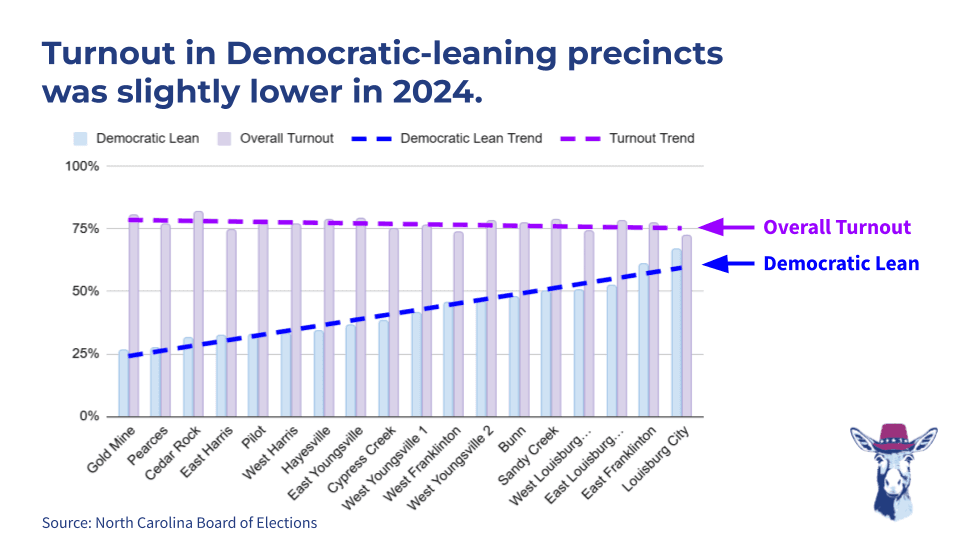
This chart shows the Democratic Lean and overall 2024 voter turnout by precinct.
In Franklin County, the Democratic Lean is slightly higher in precincts where turnout was lower, and vice-versa.
We canvass to increase voter turnout!